Latest Articles
Stay up-to-date with our favorite tips and trends.
Social Media
18 Apr 2024 • 7 min read
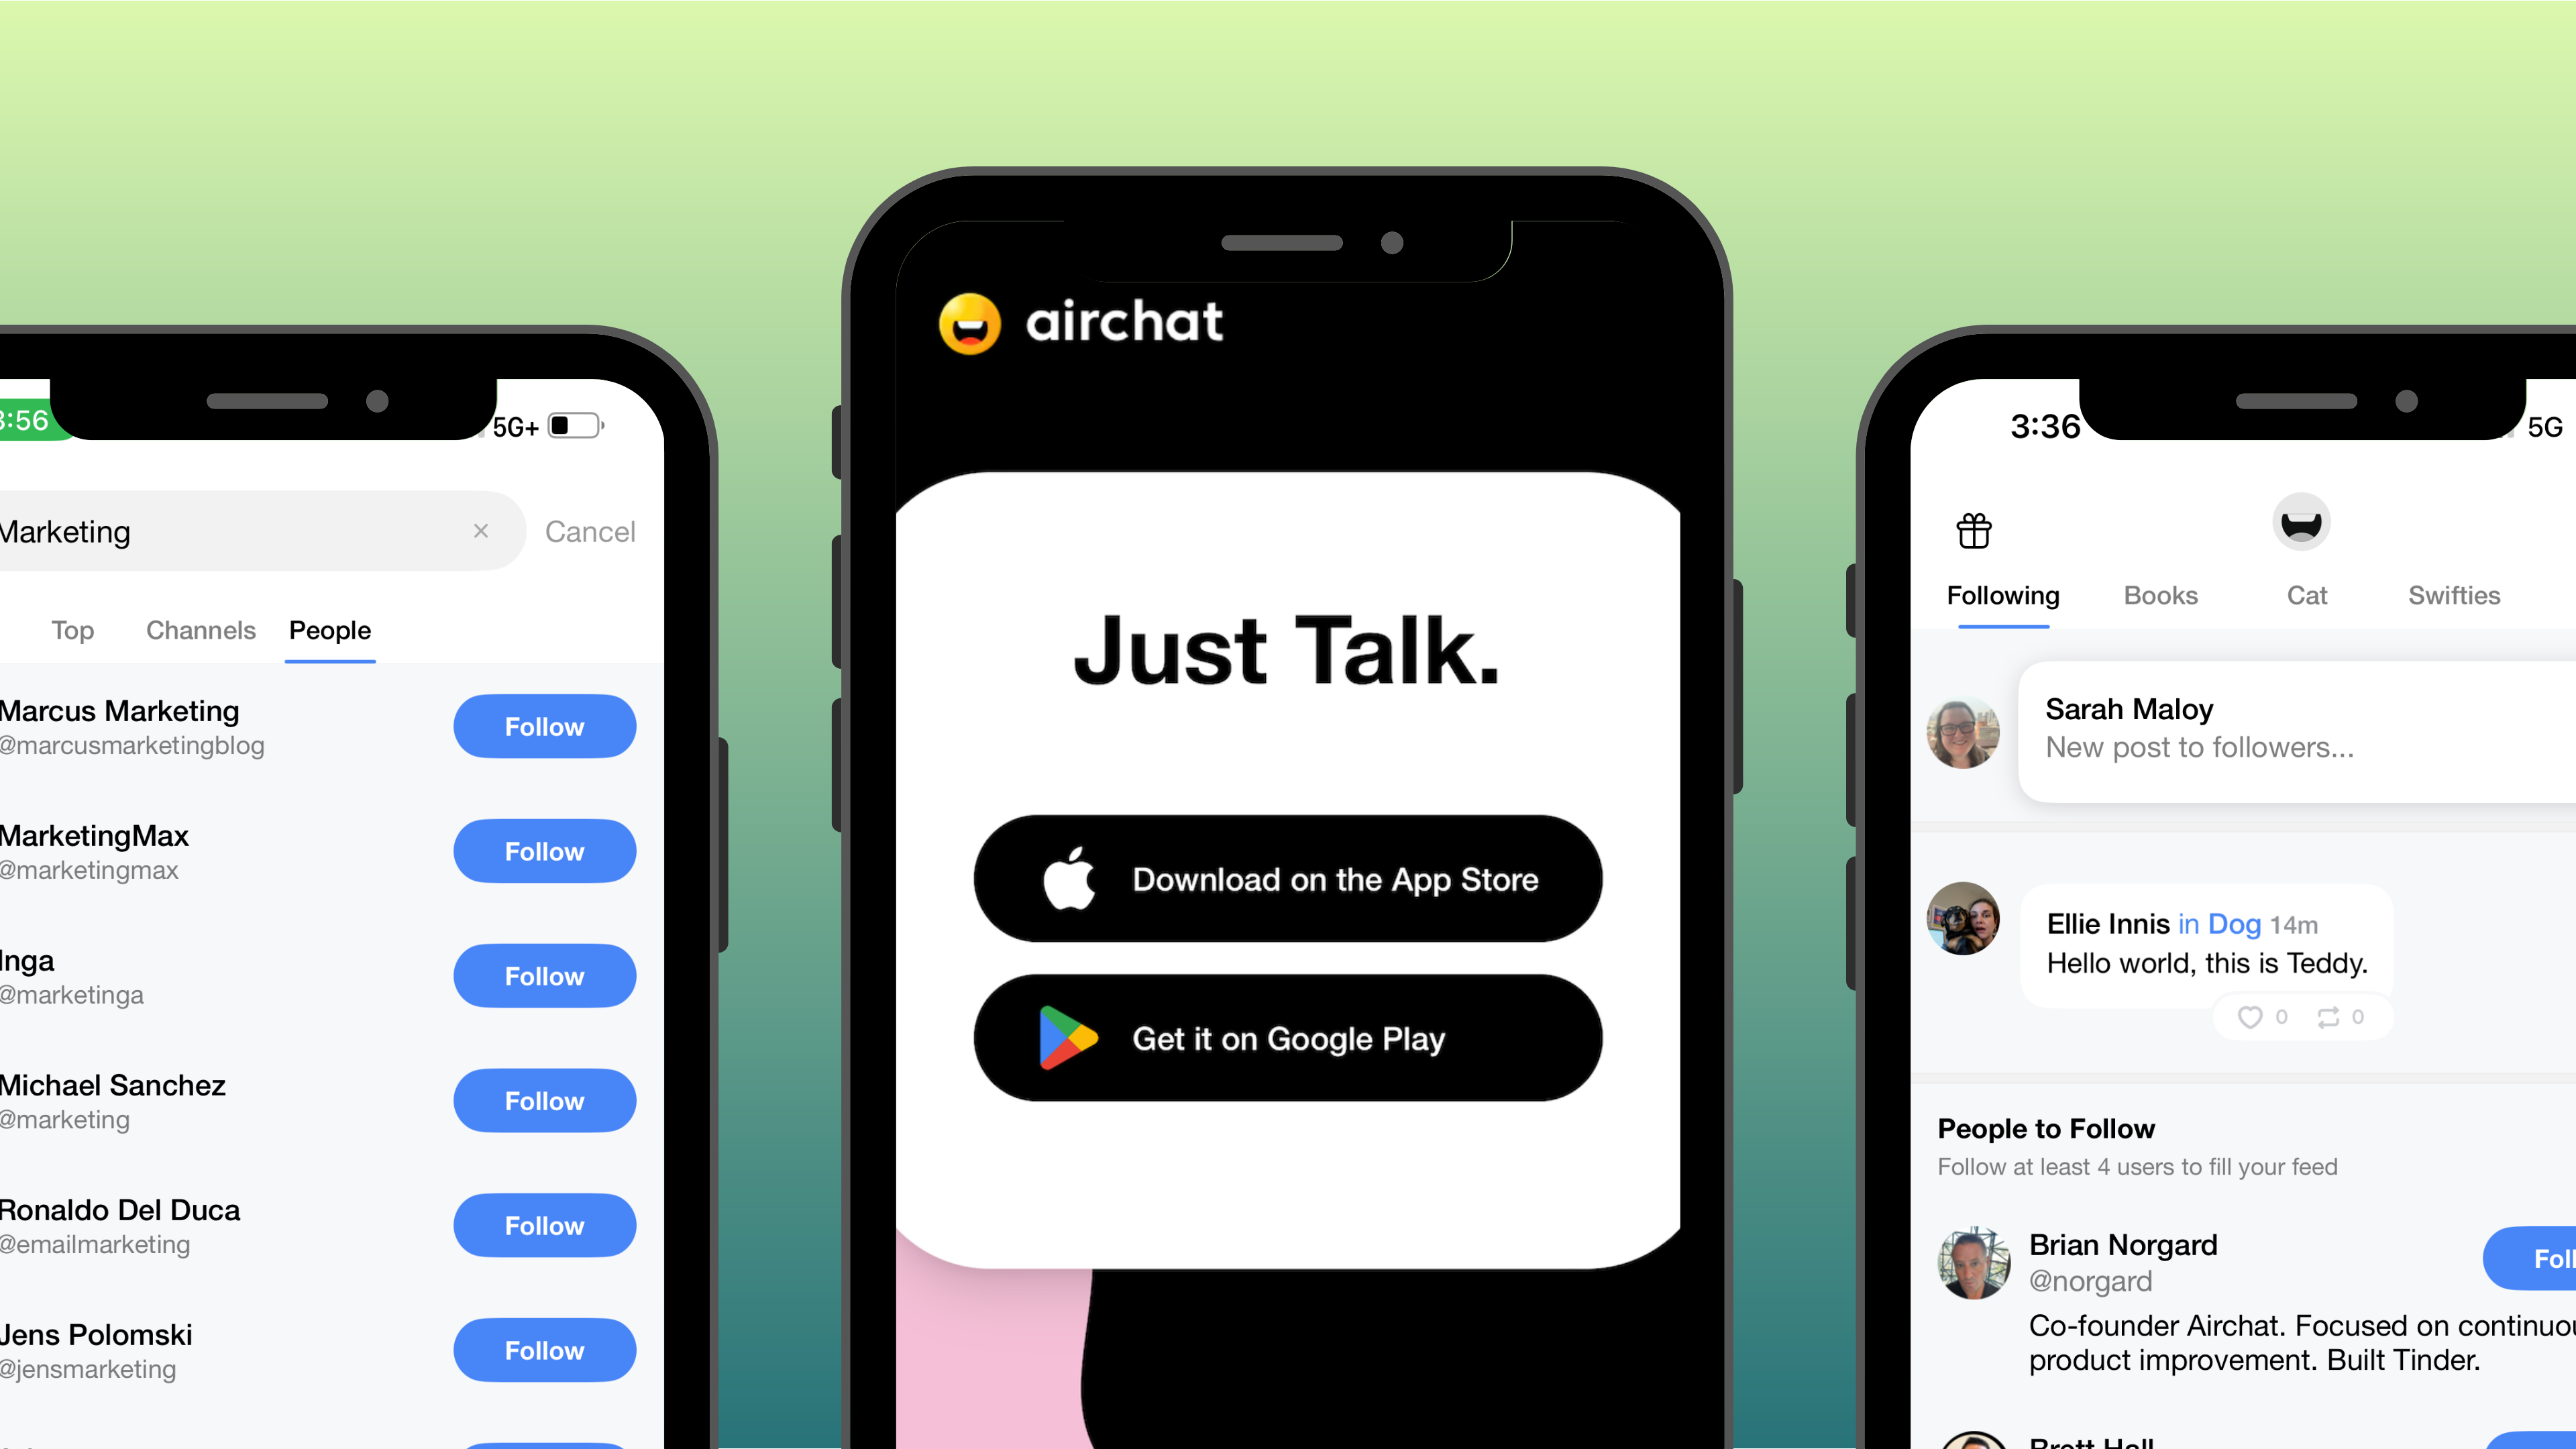
What Is Airchat and How to Get an Invite
Everyone's talking about the exclusive, invite-only, audio-based app called Airchat. We'll cover what it is, why...
Read more

Marketing
17 Apr 2024 • 12 min read
The Best Social Media Marketing Podcasts in 2024
We reviewed 90+ social media marketing podcasts to find this year's top shows.
Read more
Marketing
27 Mar 2024 • 8 min read
How to Refine Your Content Distribution Strategy
High-quality content creation is crucial for digital marketing, but you can’t just write in a vacuum. How and...
Read more
Loomly News
We're rolling out new features all the time! See what's new and how to grow your social media.
Loomly News
19 Mar 2024 • 4 min read
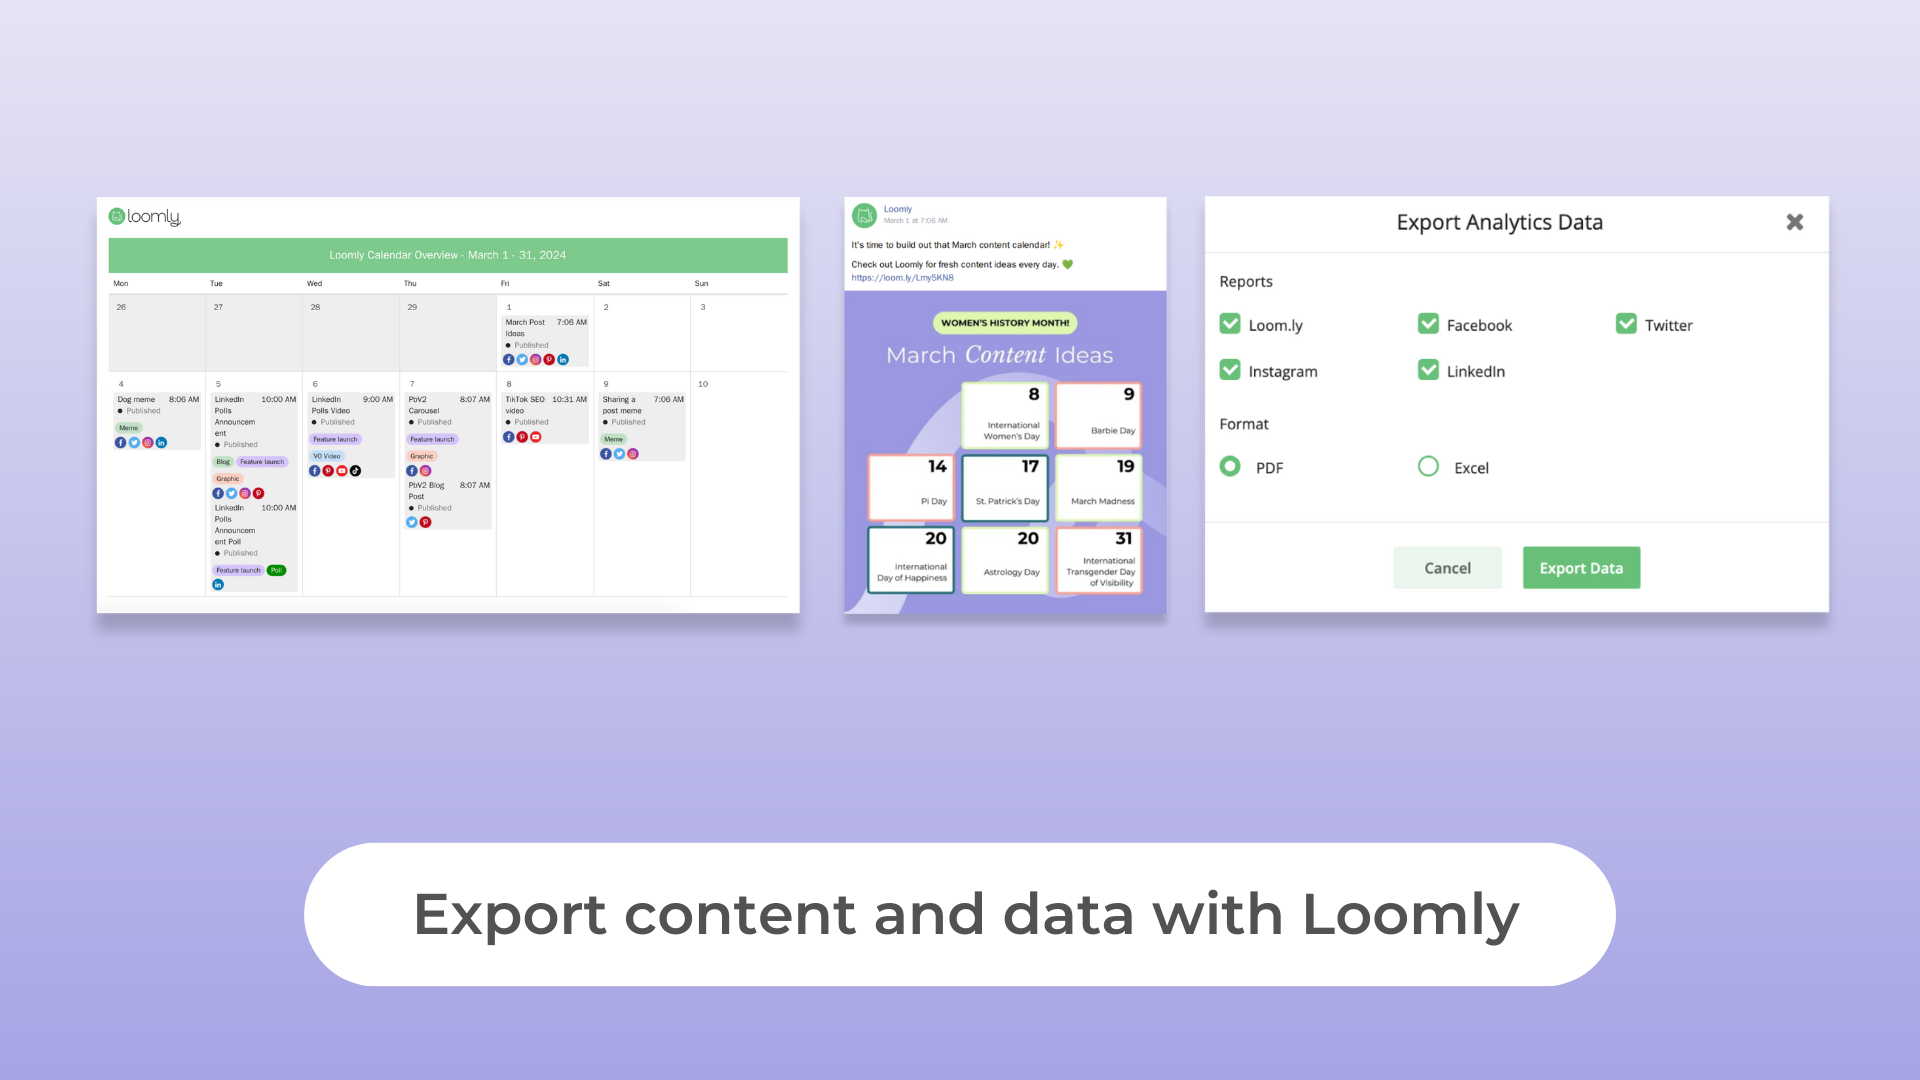
How to Export Social Media Content and Data
When planning, managing, and tracking your social media content and campaigns, having maximum flexibility to match...
Read more
Loomly News
05 Mar 2024 • 3 min read
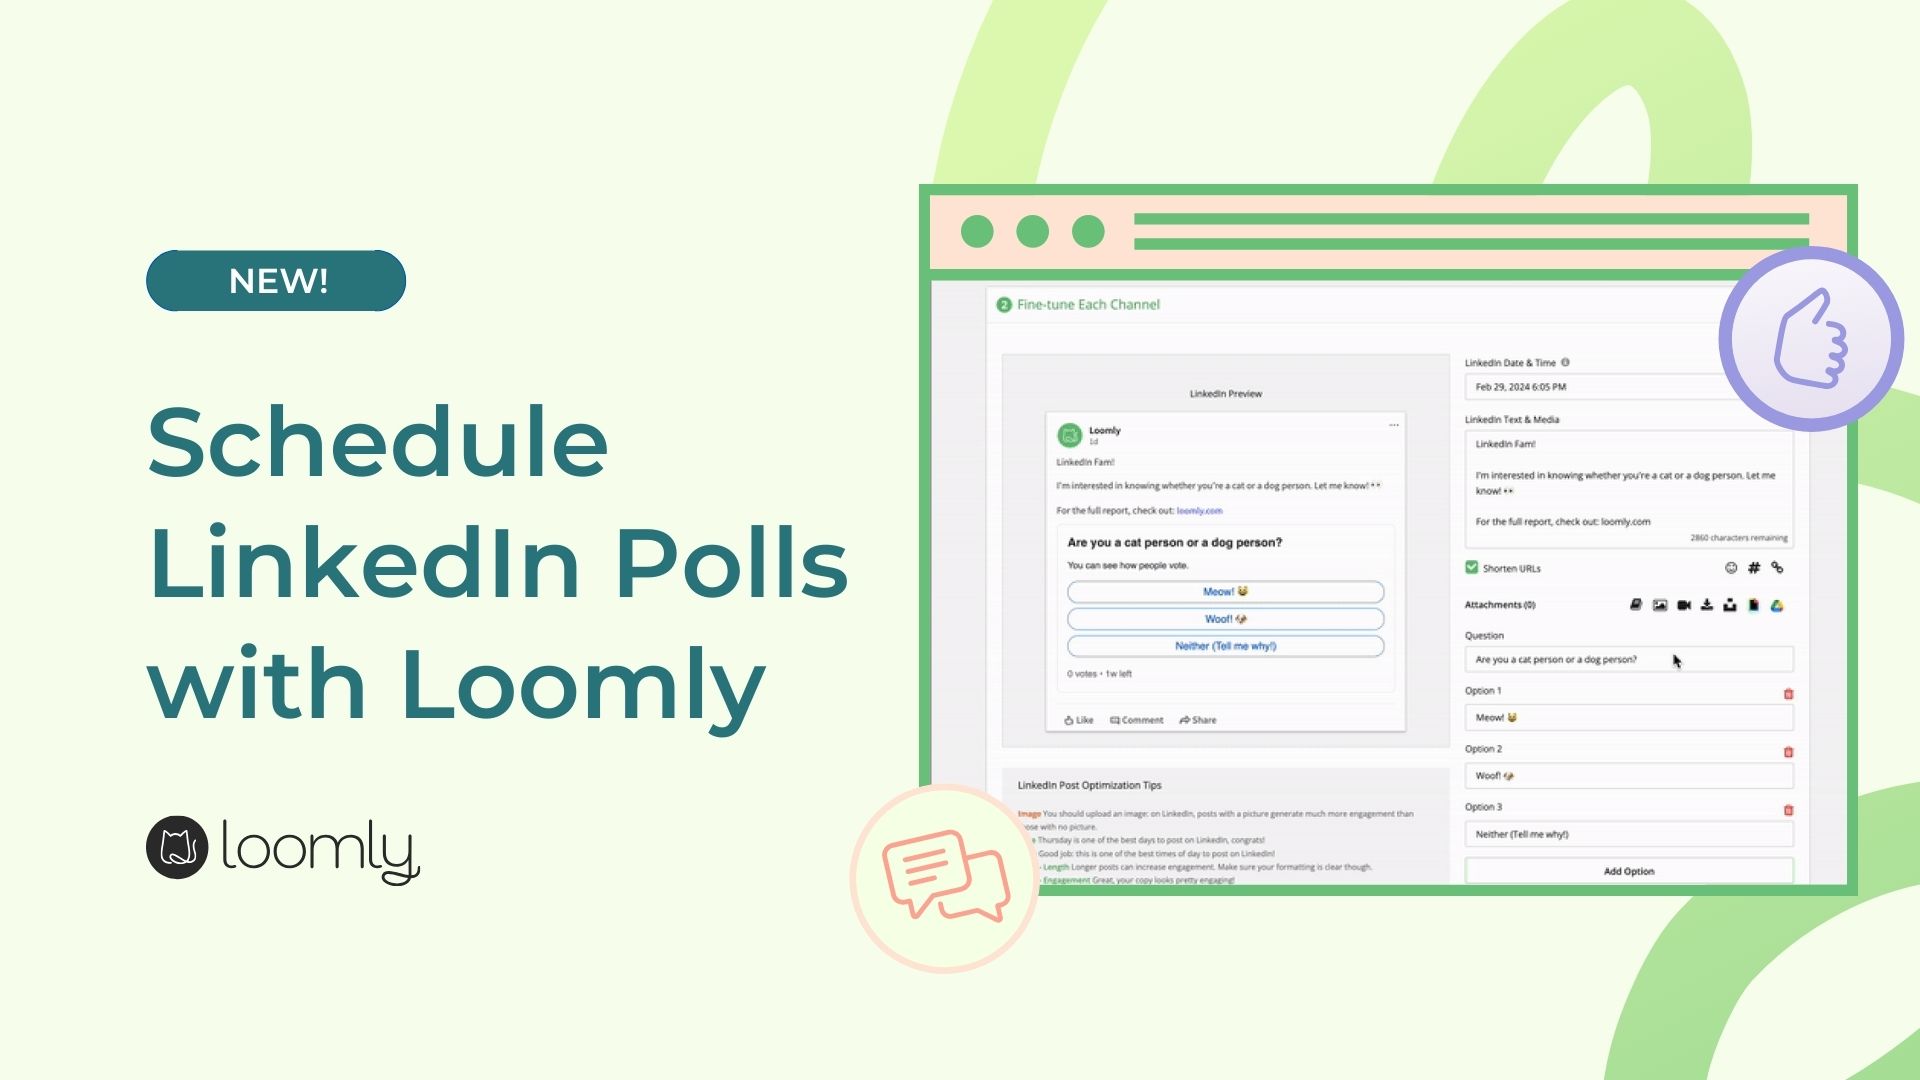
Boost Your LinkedIn Brand by Scheduling LinkedIn Polls
With over 900 million users and an impressive rate of 3 new registrations per second, LinkedIn has become a prime...
Read more
Loomly News
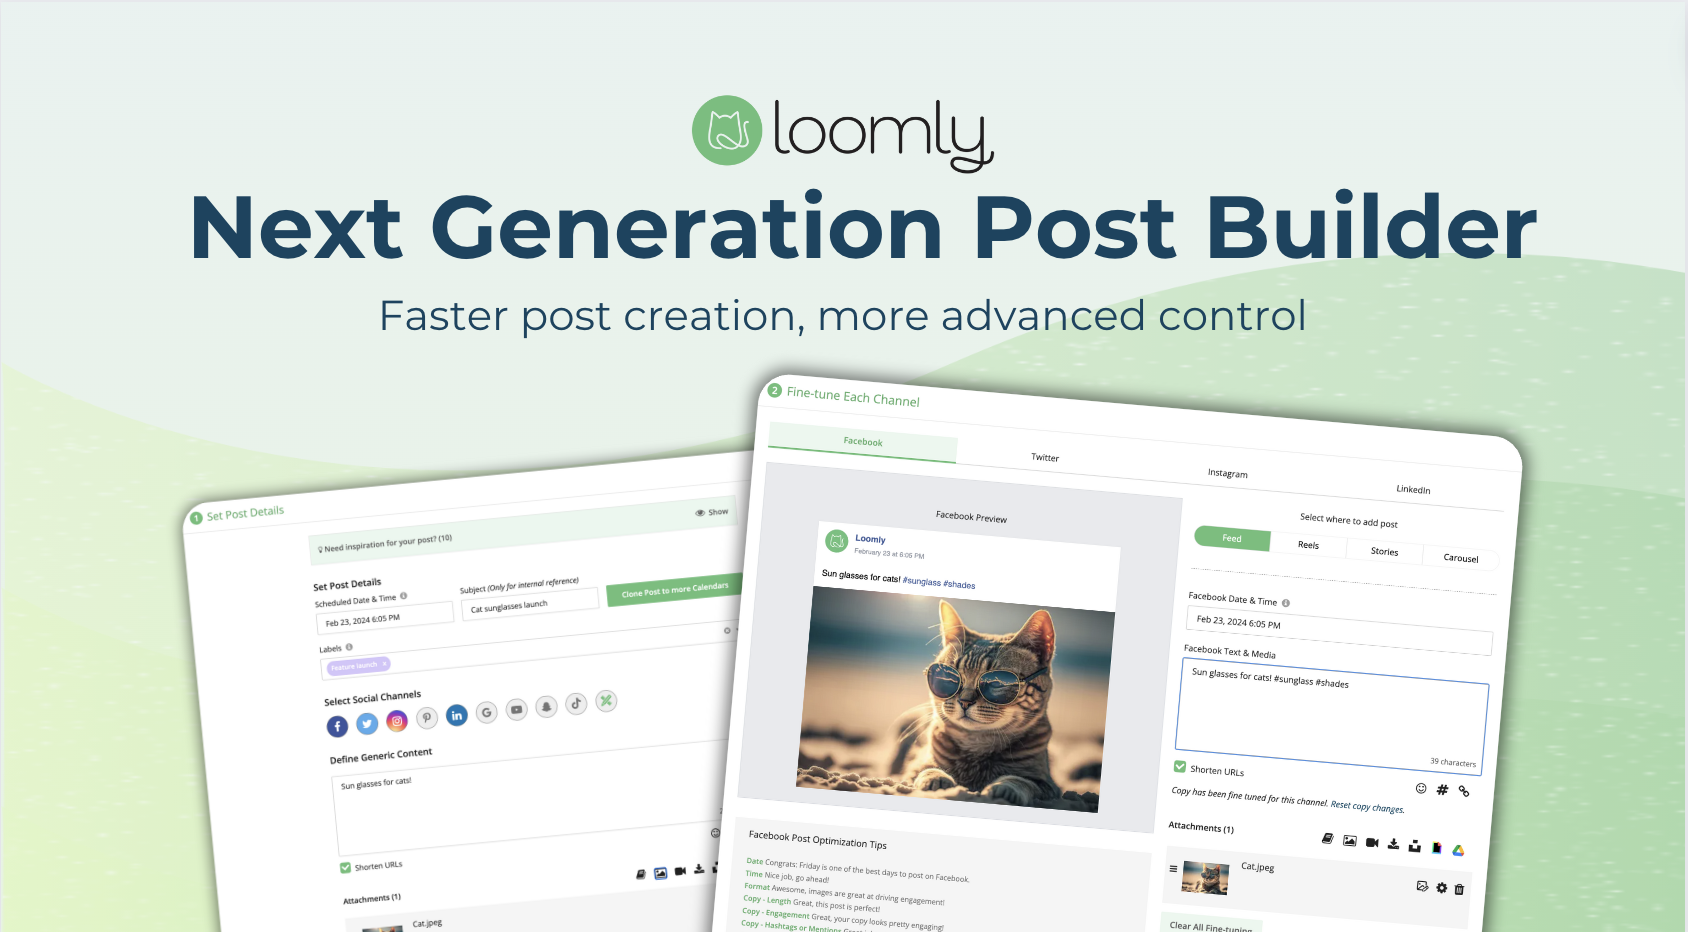
23 Feb 2024 • 4 min read
Introducing Loomly’s Next Generation Post Builder
Social media managers are constantly juggling a multitude of tasks in a short amount of time. Switching between...
Read more
Social Media
Level up your social media so you can spend less time behind a screen.
Social Media
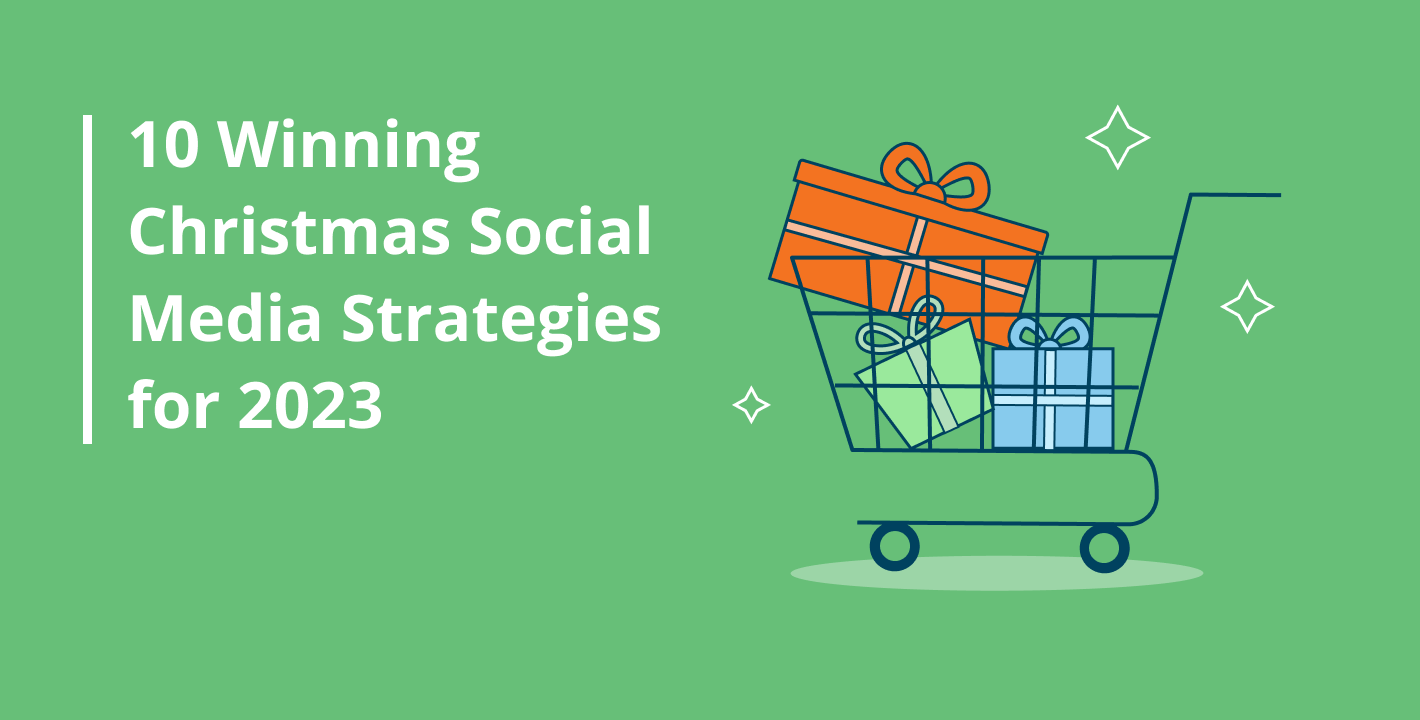
11 Dec 2023 • 10 min read
10 Winning Christmas Social Media Strategies for 2023
The fourth quarter of the year is upon us, with the most extensive shopping period — the winter holiday season.
Read more
Social Media
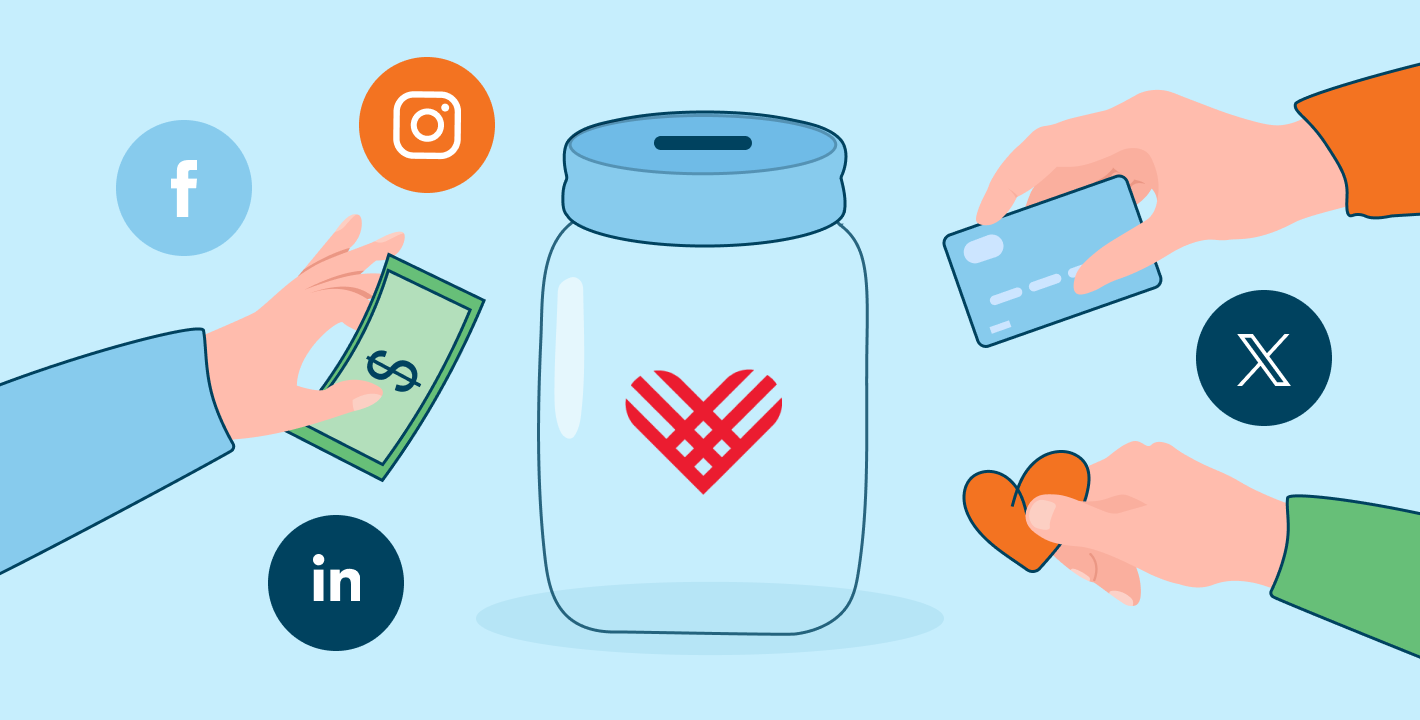
20 Nov 2023 • 8 min read
Giving Tuesday Social Media Posts: 21 Tips for 2023
Last year, the total funds raised for communities, causes, and non-profits on one day in the US alone reached $3.1...
Read more
Social Media
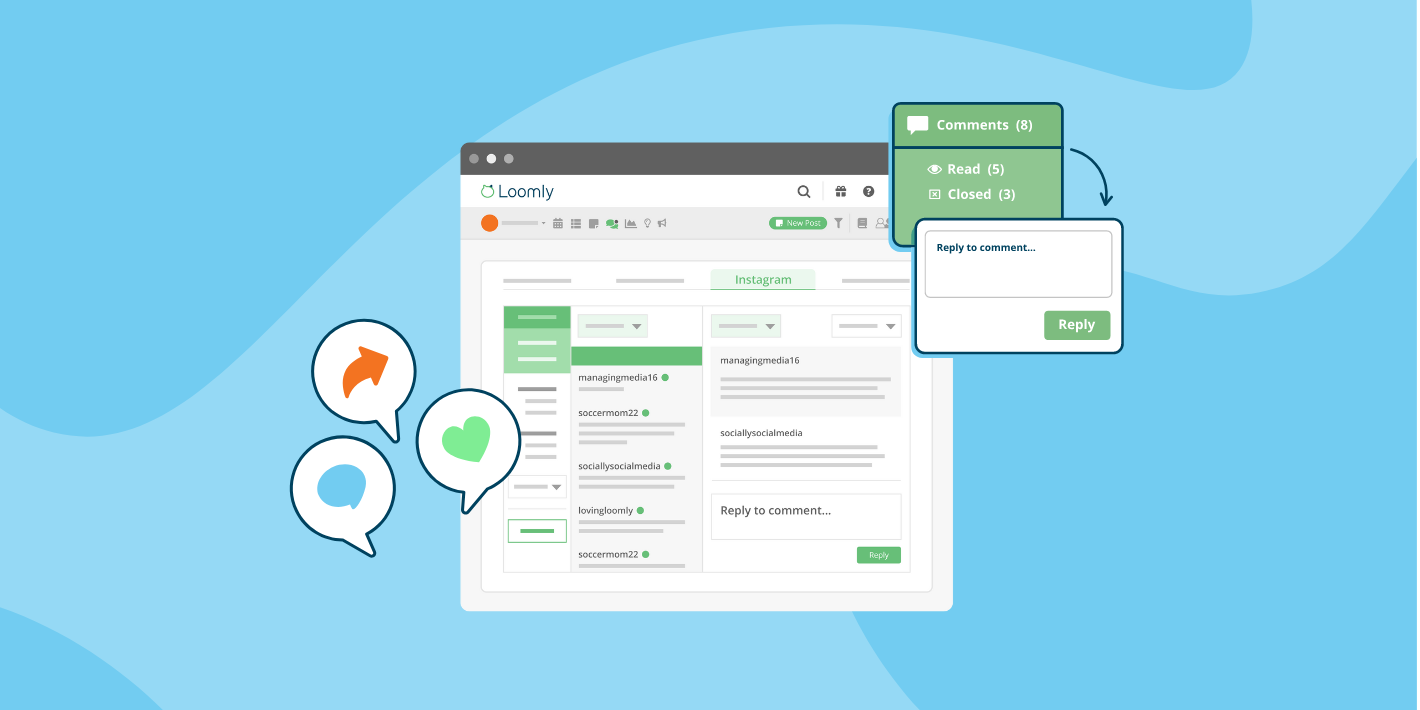
02 Oct 2023 • 1 min read
Social Media Community Management Made Easy
In the rapidly changing landscape of social media, maintaining a strong connection with your followers is...
Read more
Marketing
Get insider advice on all things marketing.
Marketing
06 Feb 2024 • 7 min read
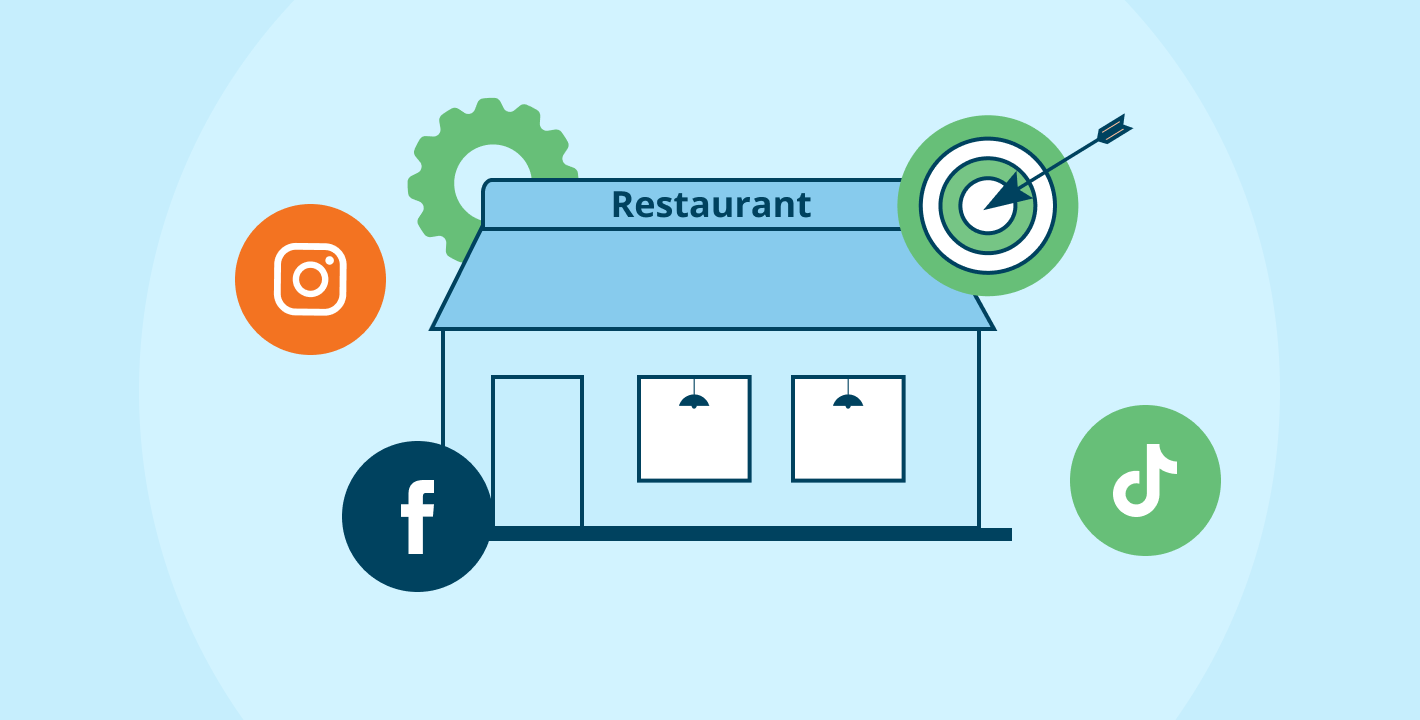
Social Media Marketing for Restaurants: The Ultimate Guide
In the era of endless scrolling, your restaurant’s social media presence is no longer a “nice-to-have.” It’s a...
Read more
Marketing
29 Jan 2024 • 4 min read
How to Find the Best Social Media Marketing Services for Your Small Businesses
The social media landscape is evolving — and it now requires more creativity and a larger workforce than ever...
Read more
Marketing
16 Jan 2024 • 8 min read
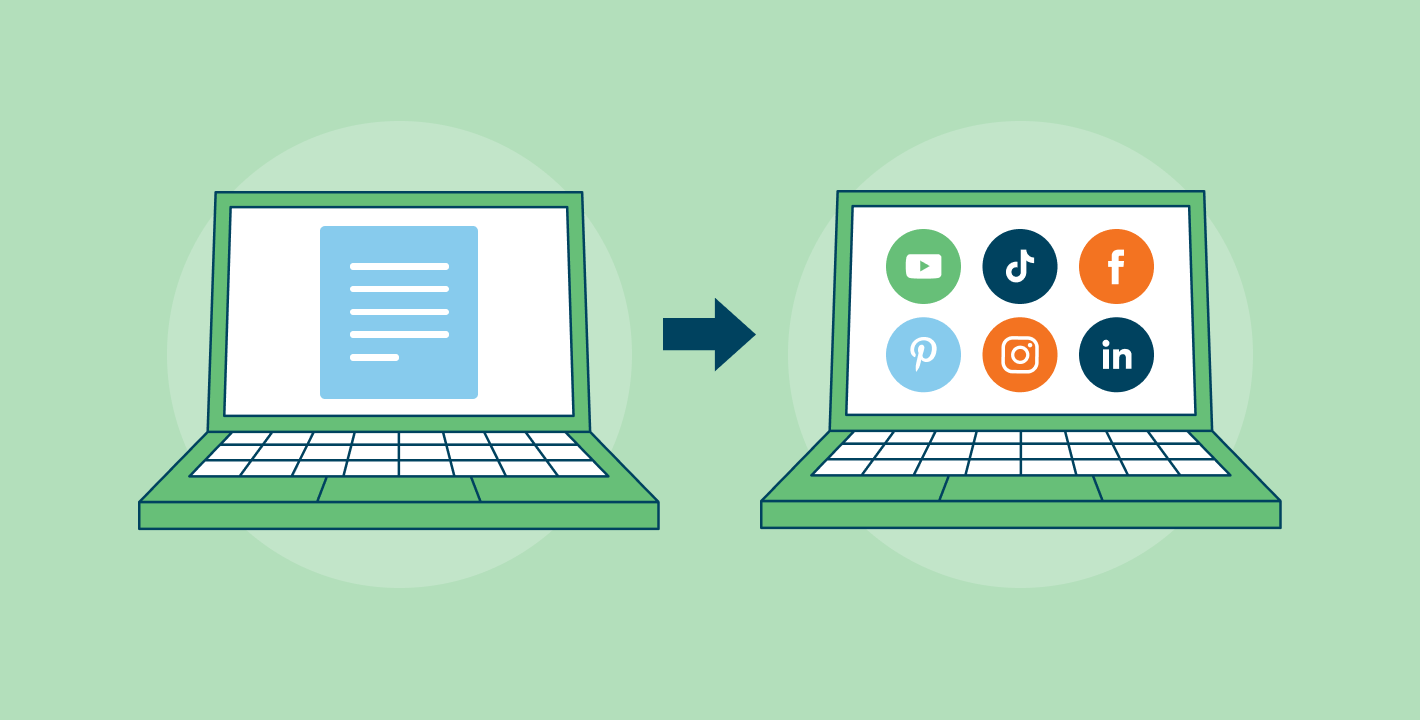
7 Tips to Repurposing Content for Social Media (2024)
Repurposing content for social media is a survival skill for social media marketers.
Read more
Collaboration
Learn how to better collaborate with coworkers, clients, stakeholders, and more.
Collaboration
27 Feb 2024 • 10 min read
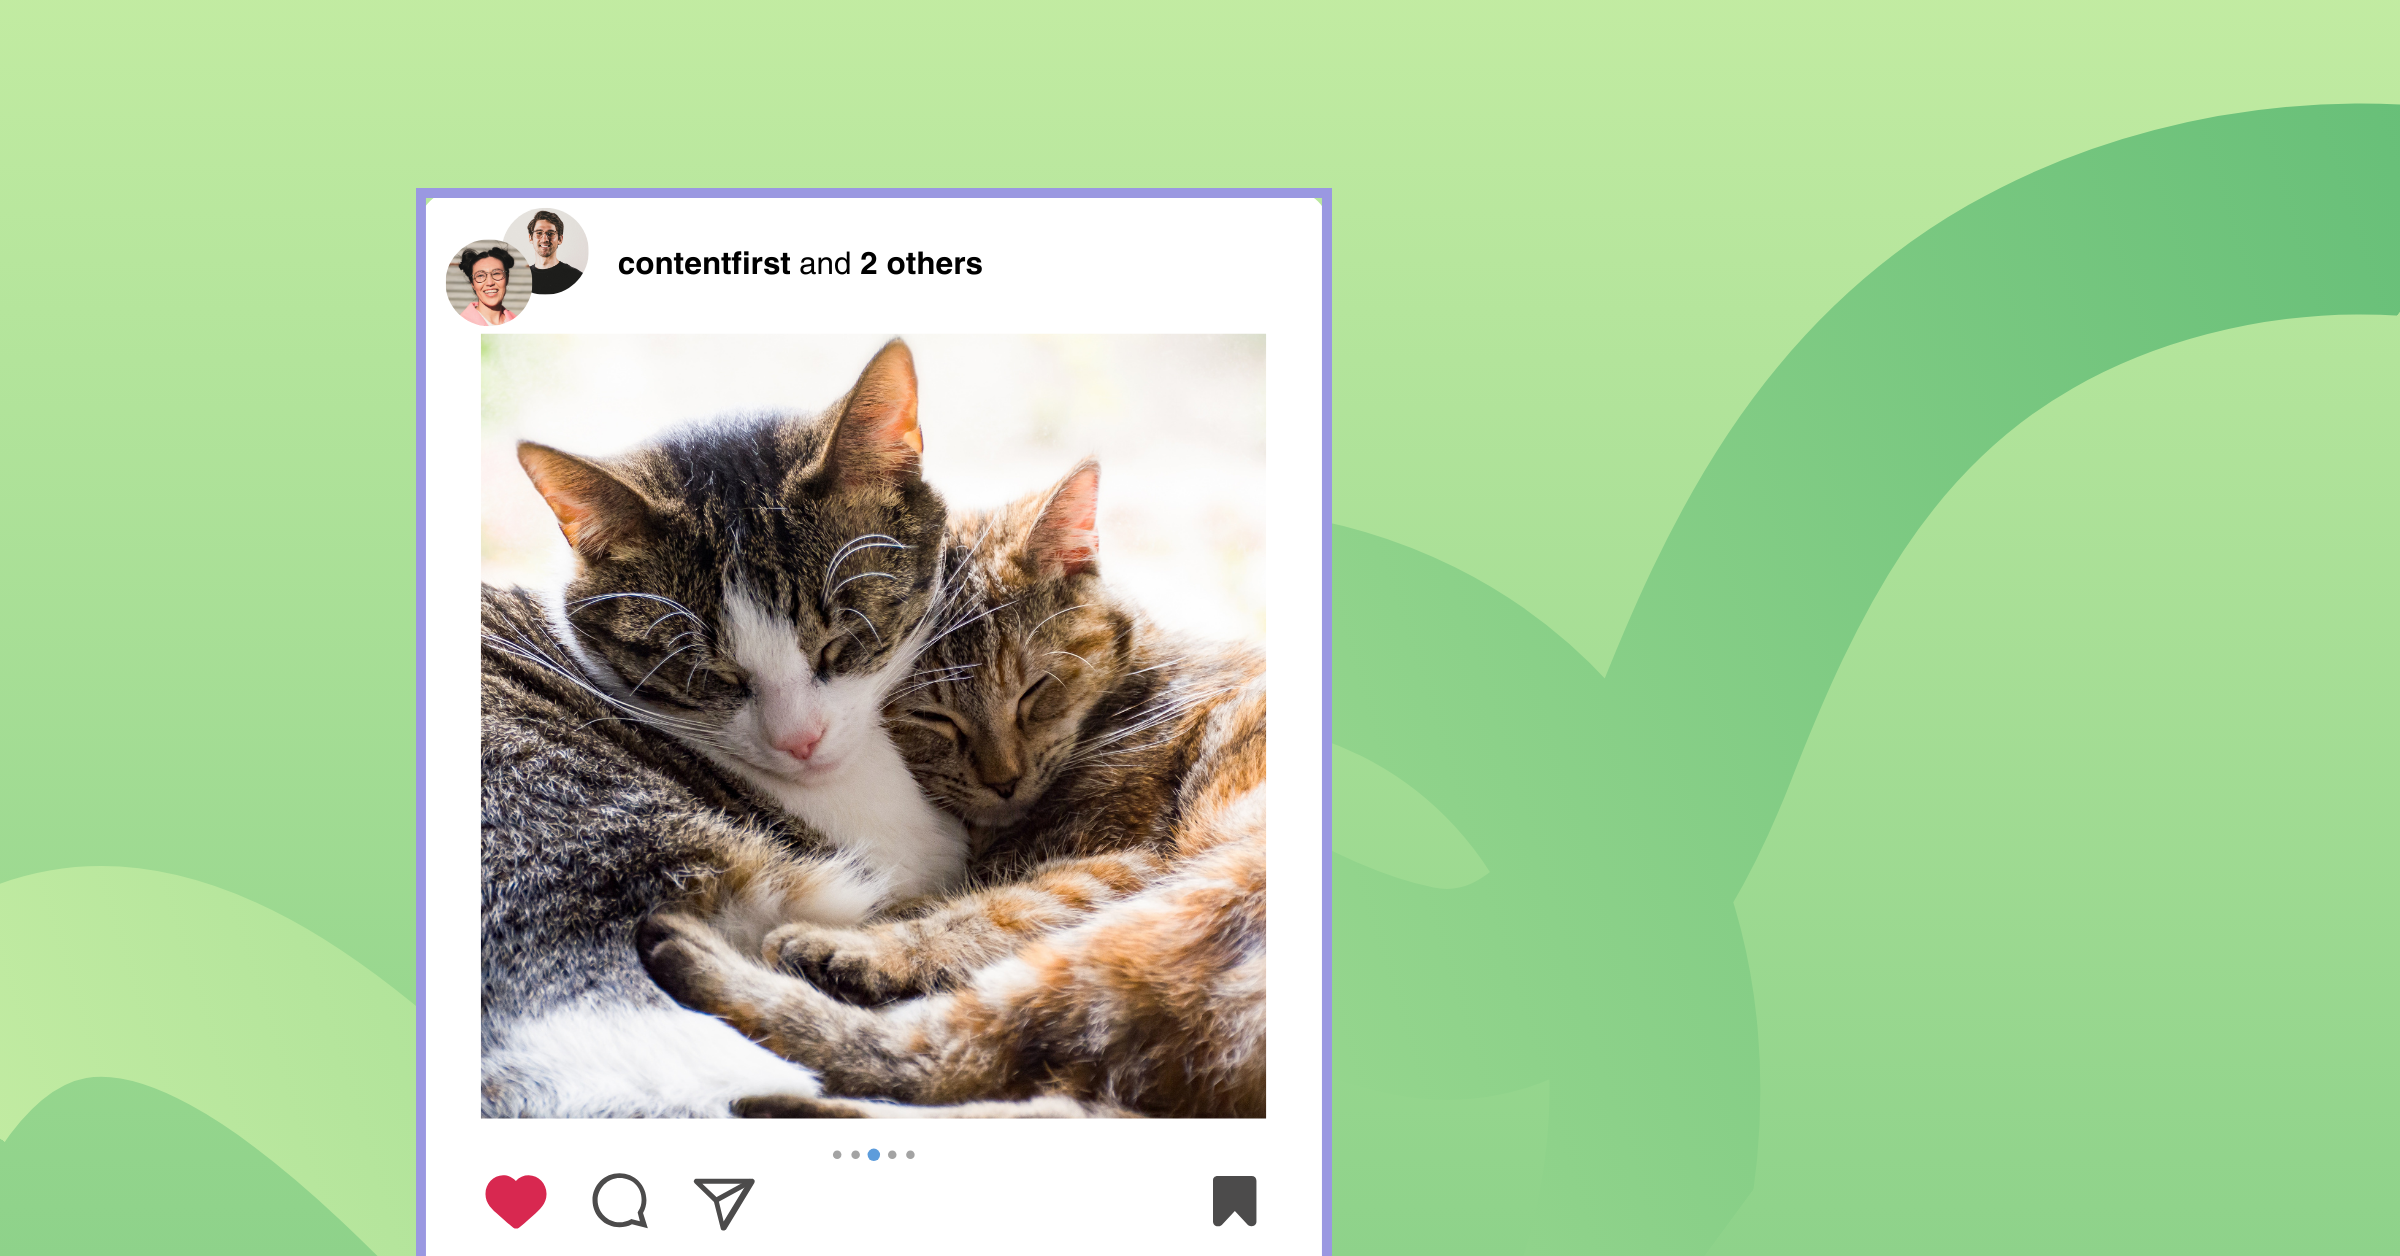
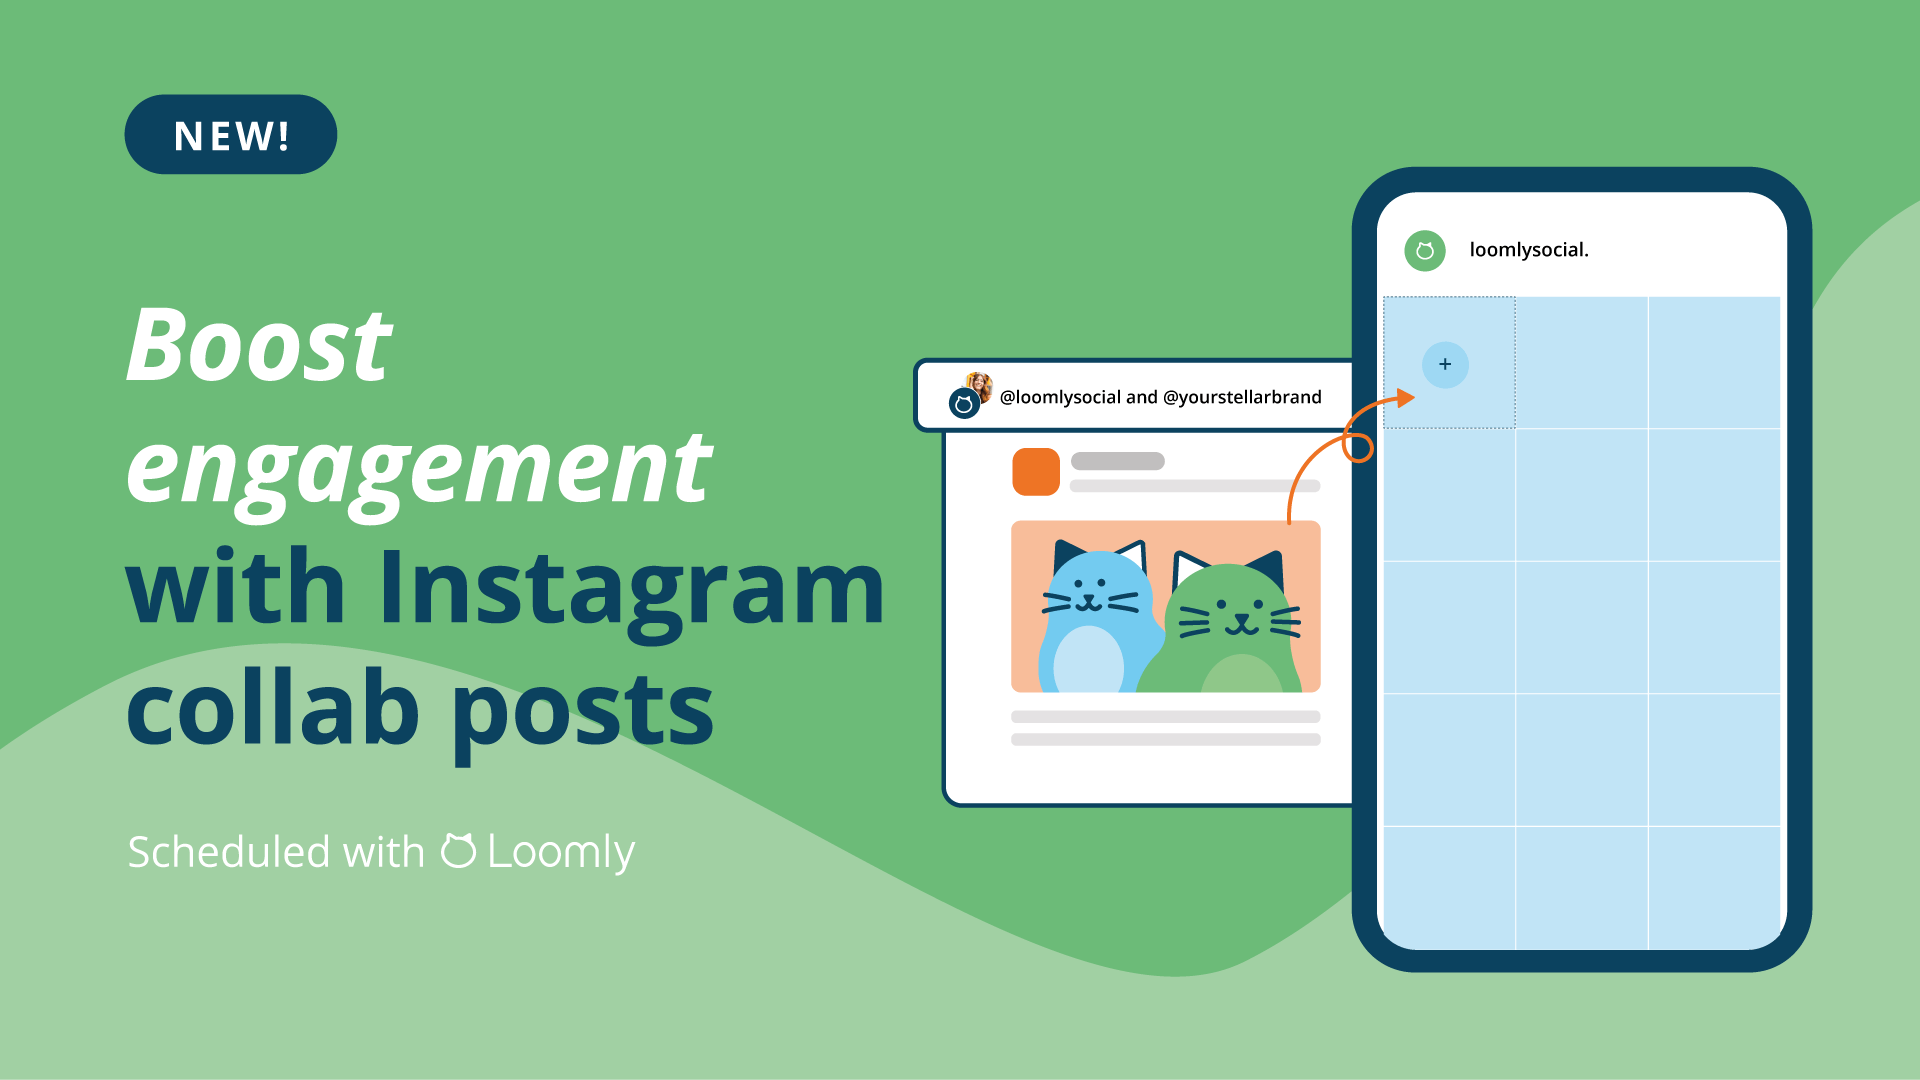
How to Use Instagram Collab Posts to Increase Engagement
Instagram collab posts are for perfect matches – peanut butter and jelly, cookies and milk, apples and pie. They...
Read more
Collaboration
29 Nov 2023 • 2 min read
Schedule Instagram Collab Posts with Loomly
Need a quick way to double the reach of every post you share on Instagram? Add a collaborator or two to see an...
Read more
Collaboration
29 May 2023 • 8 min read
5 Steps to Create a Community Online in 2023
Nearly 5 billion people will use social media this year.
Read more